Okay, okay…I know oil & gas prices is not new news by any means. Even I and my colleague, Amy, have written countless blogs regarding the oil & gas industry’s market in some way. I find myself hanging my head low as we ring in the new year because of all the negative buzz about the 2016 outlook on oil prices. Here is a hint: it doesn’t look that great. Every week I still hear of company-wide layoffs and living in Houston, I meet people who are desperately looking for jobs after being laid off. On top of the market being low, new regulations seem to be put in action more and more. In fact, Amy just did a blog on new proposed regulations in Pennsylvania last week! So the more I thought about the recent prices, I started wondering…What is the “normal” price of oil? When do companies start actually losing money when drilling for oil based on the cost per barrel?
What is a Break-Even Point?
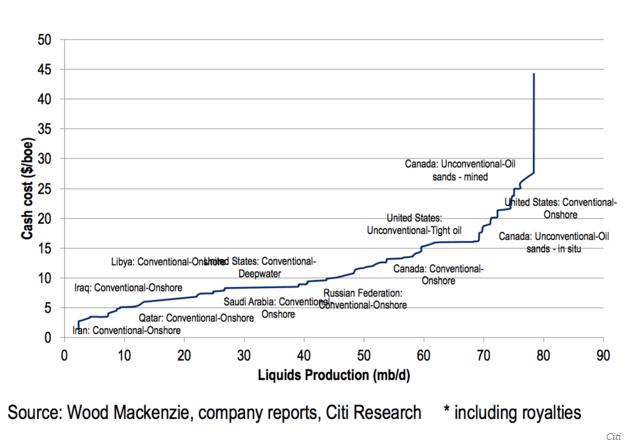
When wells are drilled there are costs involved, just like pretty much anything. There are capital expenditures and operational expenditures. If you have ever driven past or seen pictures of a well site, there are a lot of big operations that you can see going on. This doesn’t even include the things you can’t see. All that stuff and all the operations that go along with it… cost some money! So when you counter in all of the expenses that is in included in drilling and retrieving oil, and you come to a point which you can begin making a profit, that is your break-even point. SImply put, the break-even point is when the company’s profits equal to zero. The chart below shows the break-even cost for each country and the type of production.
International Break-Even Points
I found a really good website, marketrealist.com, that breaks down the break-even points between non-OPEC countries and OPEC countries. Don’t know what Opec is all about? Check out this blog Amy wrote explaining it all! Below are some OPEC countries.

Check out the chart above. It is a really good infographic showing the total costs of producing oil for the above countries. So take a look at Kuwait. You can see their break-even point is about $8.50. So Kuwait will make profit on oil when being sold more than $8.50 a barrel. If you ask me… that is way cheaper than I would have thought any country would be able to make a profit! Let’s take a look at the most expensive one on the graph, Venezuela. It looks like Venezuela breaks even at about $23 per barrel according to the graph. Saudi Arabia, the leader of OPEC, comes in at almost $10.
Non-OPEC Break Even Points
Canada and the United States fall under this category. According to MarketRealist.com, it costs about $41 to produce a barrel of crude oil in Canada and about $36.20 in the U.S. Some areas in the Bakken can produce oil for a low as $24 but other areas may be $42 up to over $60.
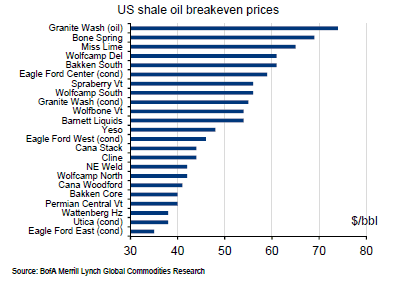
The chart above shows a breakdown of the break even prices for some U.S. shales. Take a look at the Eagle Ford…the cost to produce oil is about $35! A lot lower compared to other shales in the United States.
Today, the price of crude oil is $31.45 per barrel. After learning the break even points for each area of the United States…it is no surprise why so many companies are struggling during this downturn. Companies are merging, having department layoffs, and closing their doors. Companies are having to look at their profits and determine if it is worth it to continue producing oil or shut in their well(s). Even though they may not be making a profit, sometimes it is worth it to continue producing oil.
Croft Production Systems helps keep those wells running during this down market by using economic options for production equipment. Check out our product line to see what we offer!
https://marketrealist.com/2015/12/russia-can-compete-saudi-arabia/
https://www.businessinsider.com/cash-cost-breakeven-oil-prices-2015-12
http://www.telegraph.co.uk/finance/oilprices/11283875/Bank-of-America-sees-50-oil-as-Opec-dies.html