There are multiple countries that produce oil and gas. Some more than others and some not at all. Who are the ones that produce the most? Has it changed throughout the years? This year, it is no secret that things have changed due to the slump. With wells being shut in, the numbers have changed. However, I would like to focus on the numbers up until this point. Who wins the race of producing the most?!
Oil
By Country
So in searching for the countries that produce the most oil…I stumbled up a really cool site that shows you the top producing countries and the change they have endured from 2004-2014. If you click on the picture below, it will take you to the specific site on cnn.money.com.
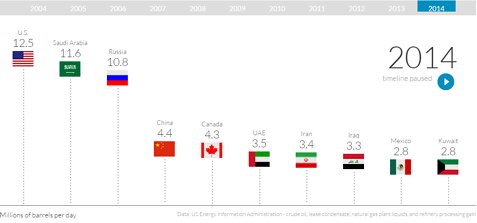
The numbers above each country represents how many millions of barrels of oil are produced per day. So as you can see America with 12.5, Saudi Arabia with 11.6, and Russia with 10.8 are the top three oil producers in the world as of 2014. The remaining countries are not as close to those numbers. Starting with China, the numbers drop to 4.4 million.
According to this timeline, in the past, Saudi Arabia has always taken the lead in the amount of oil produced. It wasn’t until 2012 that you start to see a shift and the U.S.’s numbers began to really rise.
By State
Amy and I have done many blogs and many of them happen to mention the top oil producer in America. It is definitely not a secret! Just to name a couple of blogs…Amy did a great one specifically over the Permian basin and I wrote one recently on the current rig count.
So who is the winner?? Texas of course!
The info-graphic above is from 2013. I want to focus on 2014 but I really liked the visual that this picture gives. I think it is a good way of showing the top producing states. Texas produced 10.2 billion barrels of oil last year which was a third of ALL U.S. oil production! North Dakota came in second with producing 396 million barrels. Next was California with 204 million, Alaska with 181 barrels, and Oklahoma with 124 million. Personally, if you ask me…it is pretty impressive how much in lead Texas is with those numbers!
Natural Gas
By Country
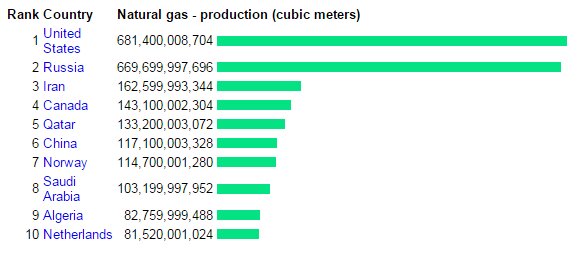
As for natural gas production…I am going to jump back a couple years and look at the year 2013. As you can tell from the info-graphic below, the U.S. came in 1st with 681 billion cubic meters! Not far behind is Russia with 669 billion cubic meters. The next three definitely aren’t as close in numbers to Russia and the U.S. but that does not mean that their production is small by any means. Third is Iran with 162 billion cubic meters, next is Canada with 143 billion cubic meters, and last is Qatar with 133 billion cubic meters.
By State
This is something that is most interesting to me…the top five natural gas producing states in the United States. Why do you ask? Well if you have read my blogs before then you already know I work in the oil and gas industry (specifically natural gas) and our headquarters are in Texas! So I always like to keep up with production and see which region is producing the most.
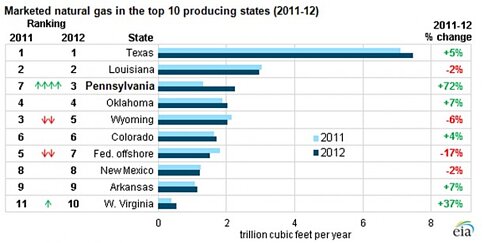
I bet you can’t guess which state the top producing state in 2014.Texas! I feel like I am starting to get repetitive. Sorry, I must boast for my state! Texas produced 7,953,343 MMcf, Pennsylvania produced 4,214,643 MMcf, Oklahoma produced 2,310,114 MMcf, Louisiana produced 1,980,287 MMcf and Wyoming with 1,791,235 MMcf. I used the chart above because I think it is cool to see the difference between production in 2011 versus 2014. You can see the changes that occurred between 2011 to 2012. Pennsylvania was the third most producing state at the time however it was the quickest growing state. Which proved to be true based on the production in 2014.
http://money.cnn.com/interactive/news/economy/worlds-biggest-oil-producers/
http://www.usatoday.com/story/money/business/2015/07/17/24-7-wall-st-oil-rich-states/30307203/
http://www.vocativ.com/money/business/us-oil-production/
http://www.indexmundi.com/g/r.aspx?t=10&v=136
http://www.eia.gov/dnav/ng/ng_prod_sum_a_epg0_vgm_mmcf_a.htm